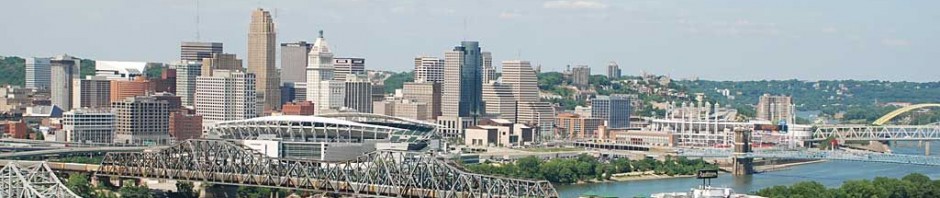
So I messed around quite a bit trying to get the real life Cincinnati into SimCity. There are actually a few tutorials on how to do that out on the various SC fansites, but they were mostly written quite a while ago and (sometimes) out of date.
In case you are not aware, the way that SC does its “regions” is through use of greyscale images. Simplistically, black is water, and white is mountains, and the different elevations are different shades of grey. So the USGS has the data out there (for free), and there are programs out there that have been written to make this process a bit easier. One is called SC4Mapper and the other is SC4Terraformer. They both do different things but they’re fairly similar and compatible.
The first tutorial I tried to use was called Making Accurate-Scale Real-World maps. Seems pretty good, right? Just what I needed? Unfortunately it didn’t really work for me. After floating around messing with it for a few days, I came across a second tutorial – this one the awkwardly titled How to Make Scale Accurate Realistic Regions from USGS Data
Despite the awkward wording, it actually proved to have pretty good content. Not perfect – it’s about a year old and there are some differences. First of all, it links to the Seamless USGS server, at http://seamless.usgs.gov/. But apparently they recently have rolled out a newer version, and so the instructions for how to download the data were not out of date and I could not figure out how to just select a rectangle, and download JUST that data. I tried doing it by 24K map, 100K map, county, etc. Nothing really gave me what I wanted. I’m certainly not ruling out user error on that one.
But then after a day or two, I found the link to the “legacy” map viewer. The legacy map viewer was not very good – I can see why they upgraded it! I couldn’t figure out how to get exactly the data I wanted THERE either. But then I realized that when I DID select something to download off that legacy viewer, it took me to a separate download page, that looked something like:
http://extract.cr.usgs.gov/Website/distreq/RequestSummary.jsp?PR=0&CU=Native&ZX=-1.0&ZY=-1.0&ML=COM&MD=DL&AL=39.38,38.95,-84.09,-84.905&CS=250&PL=ND302HZ
I’m not sure what all of the URL query parameters meant, but I did notice 4 very suspicious numbers there! By changing those latitudes and longitudes into my bounding values, I was able to download 1 file that had all the DEM (Digital Elevation Model I think) data.
From there, the tutorial pretty much took over and was accurate. Well, “sort of” accurate – it also appears that the version of MicroDEM (the tool that converts the DEM data into a greyscale image) is different than the one from the tutorial – but I was able to figure things out. And some images that would have been AWFUL useful were not shown in the tutorial. Anyways, here are some of the key steps that I found useful (I was using MicroDEM Build 2010.3.23.2). Hopefully this can help anyone that follows after me.
1. There is no “Ocean Check” button under Reflectance, but I checked Sea Level check and Lake Check.
2. There was no Elevation colors option under right click – I found it under Display Parameters->Elevation. It didn’t have 2 separate dialog boxes to specify min and max altitude – instead it had a “Z range” button on Elevation. Because my map has no sea level, it had a min and max Z of 128 and 317 (in meters). So I added -314 and 619 to that, to get -182 and 747, which is what I entered.
3. I tried to use Paint but it was woefully inadequate – Irfanview worked great. One thing I noticed there is that my grid marks were not entirely square. I assume this has to do with the curvature of the earth or something (stupid earth!). So what I did was grab a 4×4 square in Irfanview and measured from the top left to the bottom right. It didn’t line up exactly with the grids, but probably gets you close enough. So my 4×4 square was something like 494 pixels wide by 527 pixels high, each corresponding to 4096m. I followed the tutorial’s instructions on resizing using that information, though I rounded up to the nearest “round” number (round in terms of 64s) – I went with 4417 wide by 2881 high, which gave me a 69×45 region (69*64+1 = 4417)
4. When saving the image out of MicroDEM, there were 2 legends on the top and bottom of the image, so I cropped those out. Well actually I first had to go download data that was a little bigger on the top and bottom than I really needed, and then cropped them out.
5. So then, I loaded it into SC4 Mapper and created a region out of a GreyScale. I just used a generic config.bmp at this point. This took awhile, and then I saved the region.
6. Then I imported it into SC4 Terraformer. For some reason the water was not showing up. I suspect that the tutorial’s instructions on altitude were a bit out of date. Rather than monkeying around with MicroDEM, SC4TF was much easier to use. I just used the Global tool “Lower terrain” until the rivers looked right (Usually around 13-20 units).
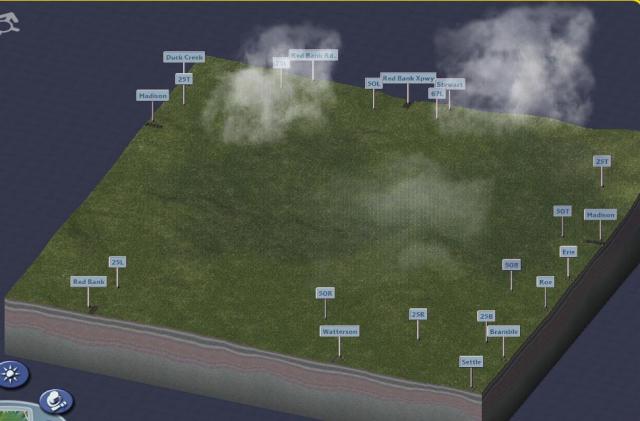
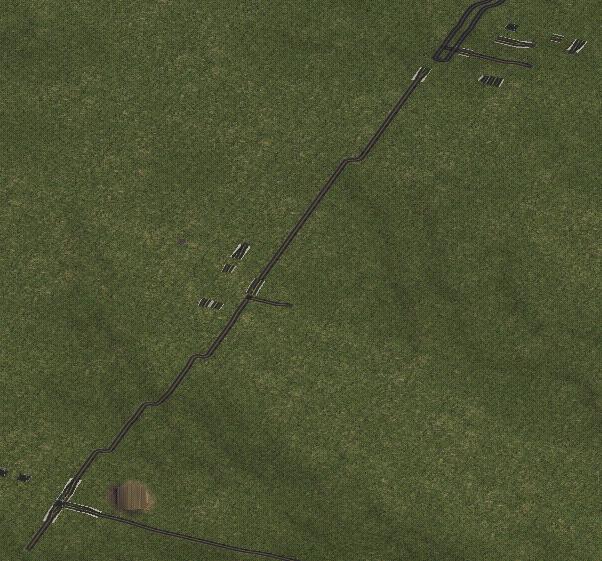
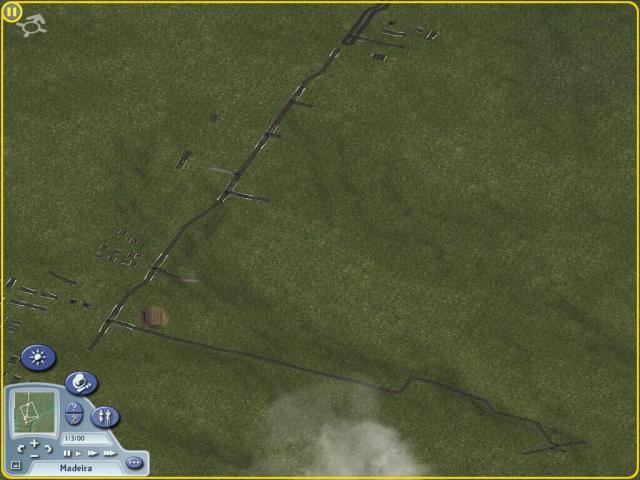
That got me to here:

The bigger boxes are 4×4 “cities” inside the region. And you can see the basic layout of the city, though I will do some hand terraforming especially in the river regions.
But next up – making config.bmp!